BioSimSpace.Notebook
The Notebook package contains tools that are used when BioSimSpace is run interactively, e.g. within a Jupyter notebook.
Functions
|
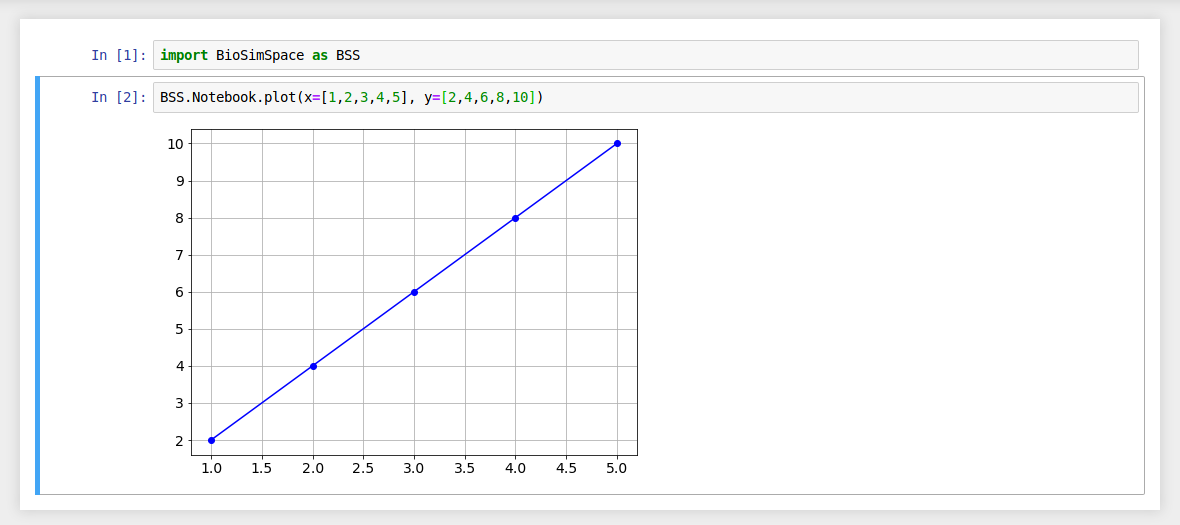
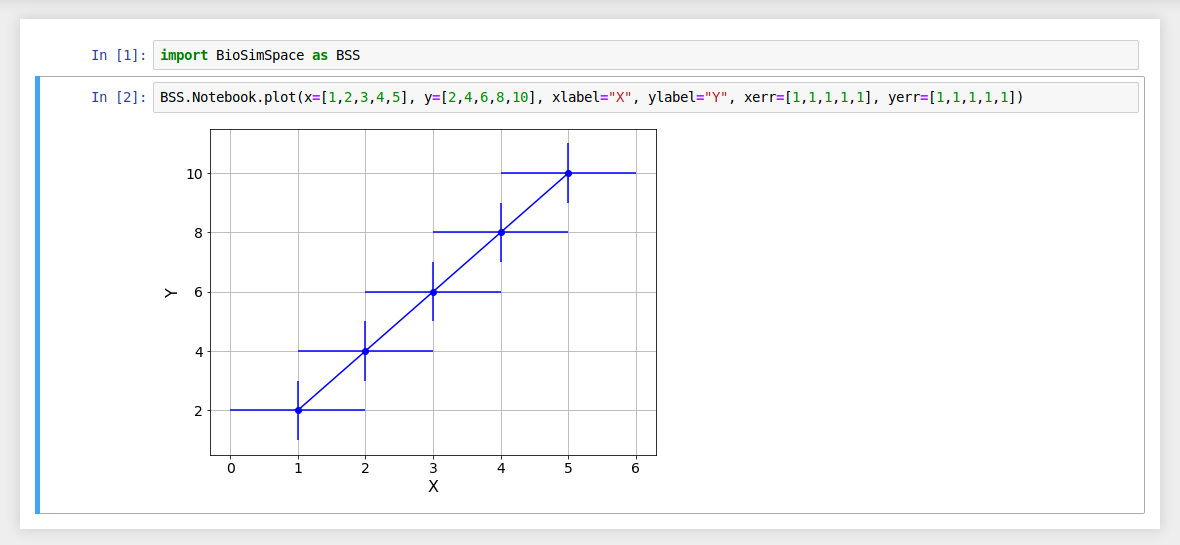
A simple function to create x/y plots with matplotlib. |
|
A simple function to create two-dimensional contour plots with matplotlib. |
|
Plot the overlap matrix from a free-energy perturbation analysis. |
Examples
Generate a line graph using two lists of data.
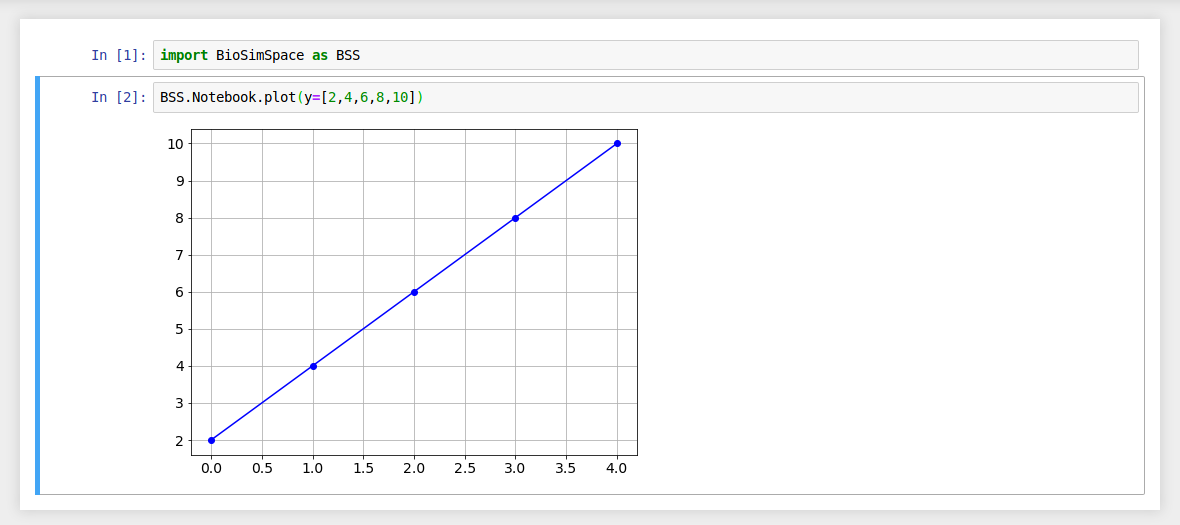
If no argument is passed for the x data then each y data value is
plotted against its list index.
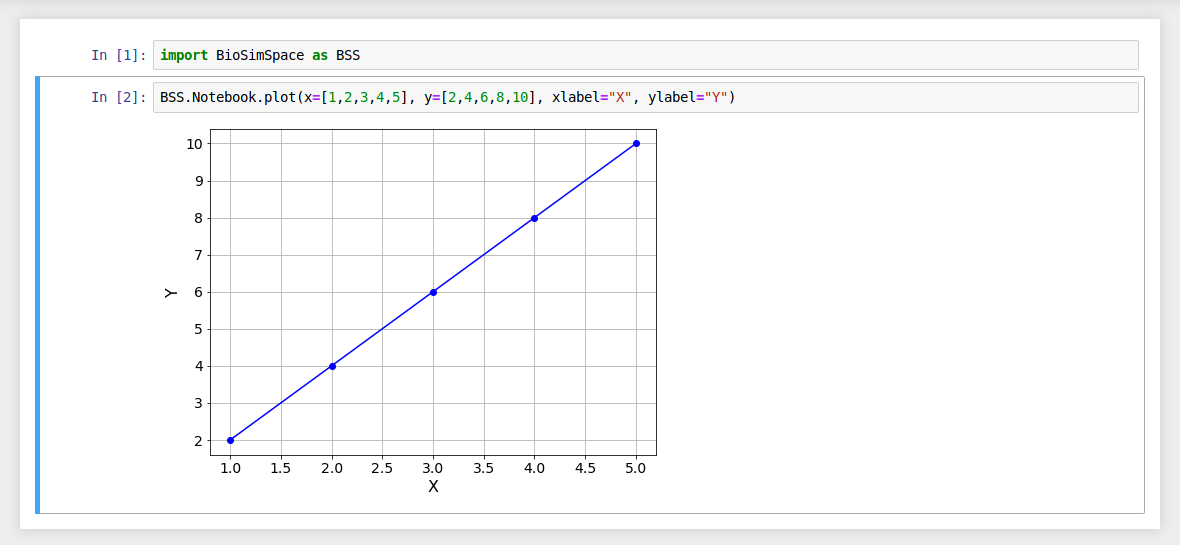
Use the xlabel and ylabel arguments to add labels to your plots.
Error bars can be added using xerror and yerror.
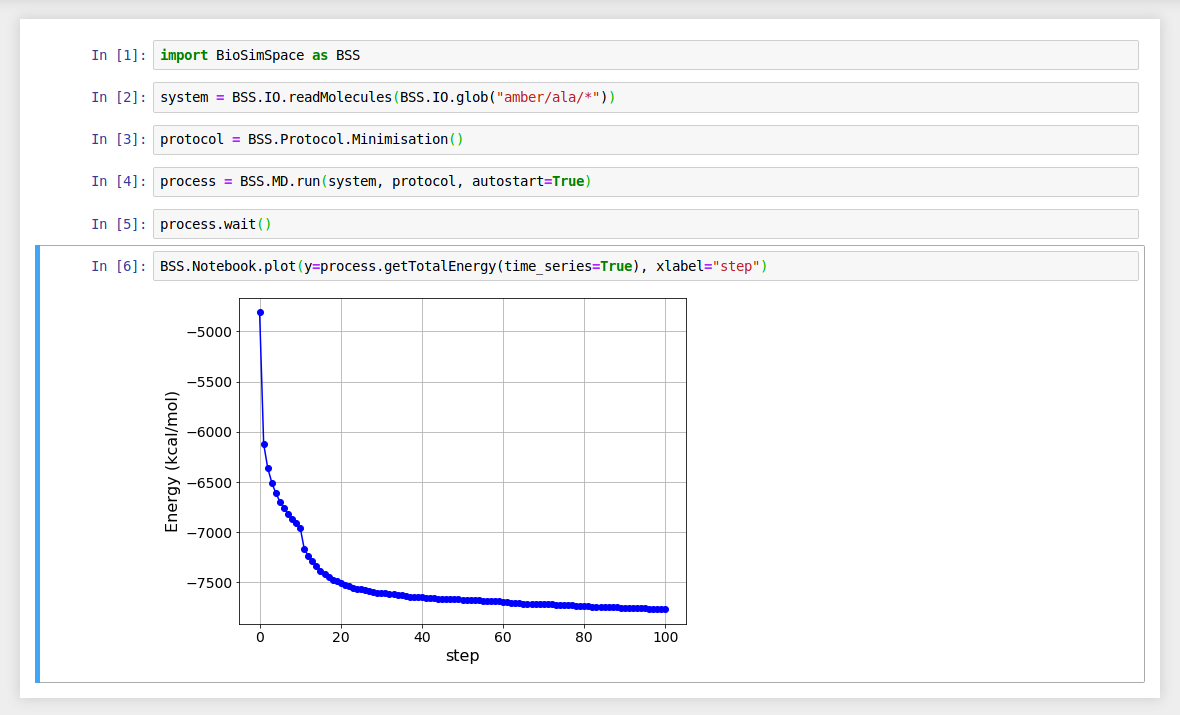
It is possible to generate plots from the output of a real-time simulation.
Where functions return time-series data containing BioSimSpace.Types, then
axis labels will be automatically generated. (The xlabel and ylabel
still take precedence.)
Classes
|
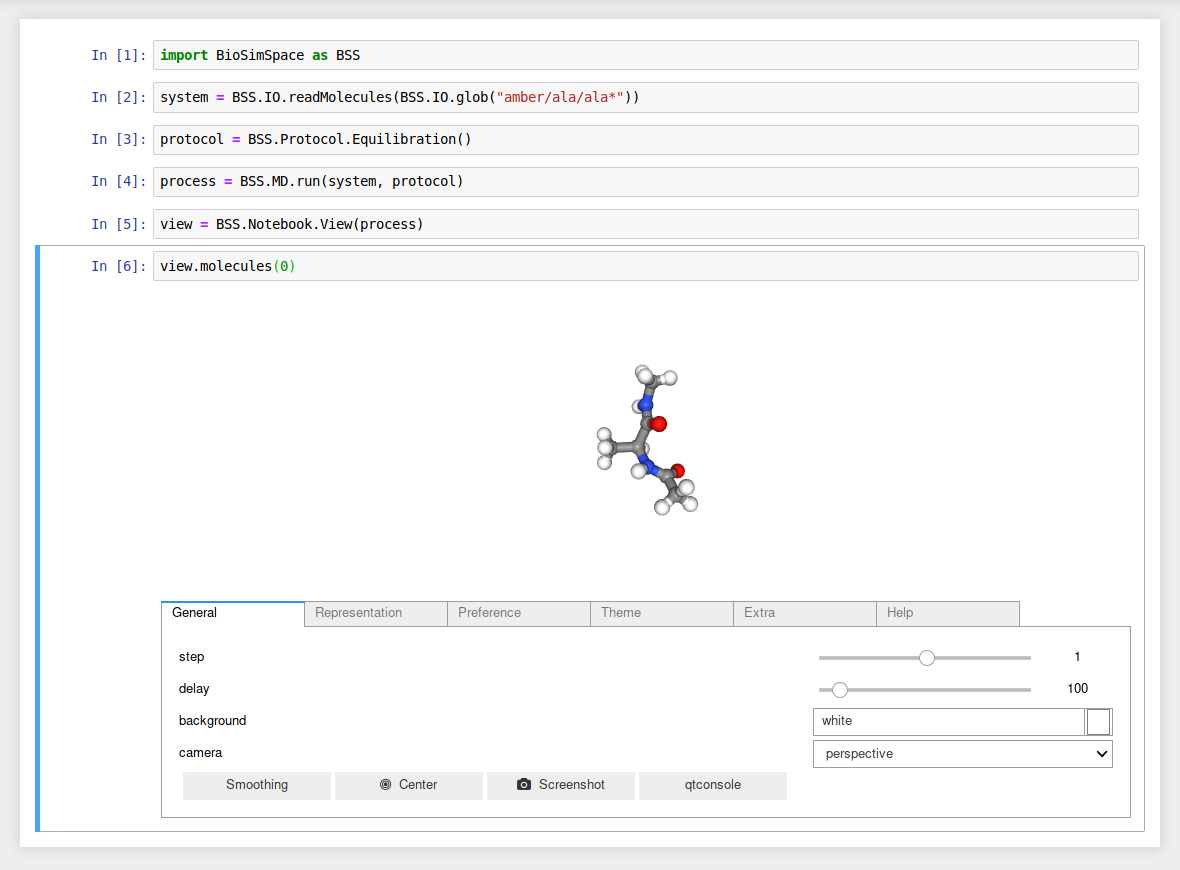
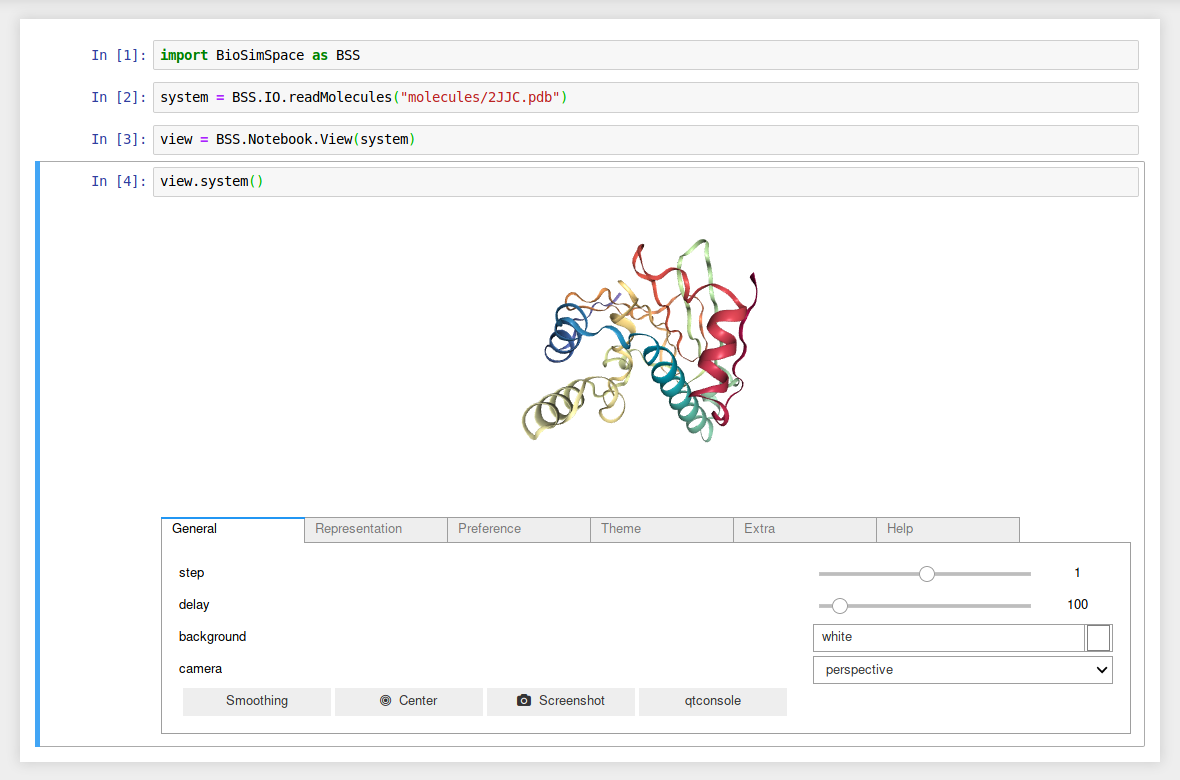
A class for handling interactive molecular visualisations. |
Examples
Load and visualise a molecular system.
Attach a View to a running molecular
dynamics Process and visualise the first molecule in
the system from the latest configuration in real-time.